1.2 What is RStudio?
RStudio is a free program that makes working with R easier. An example screenshot of RStudio is shown in Figure 1.2. We have already introduced what is in the top-left pane - the Script.
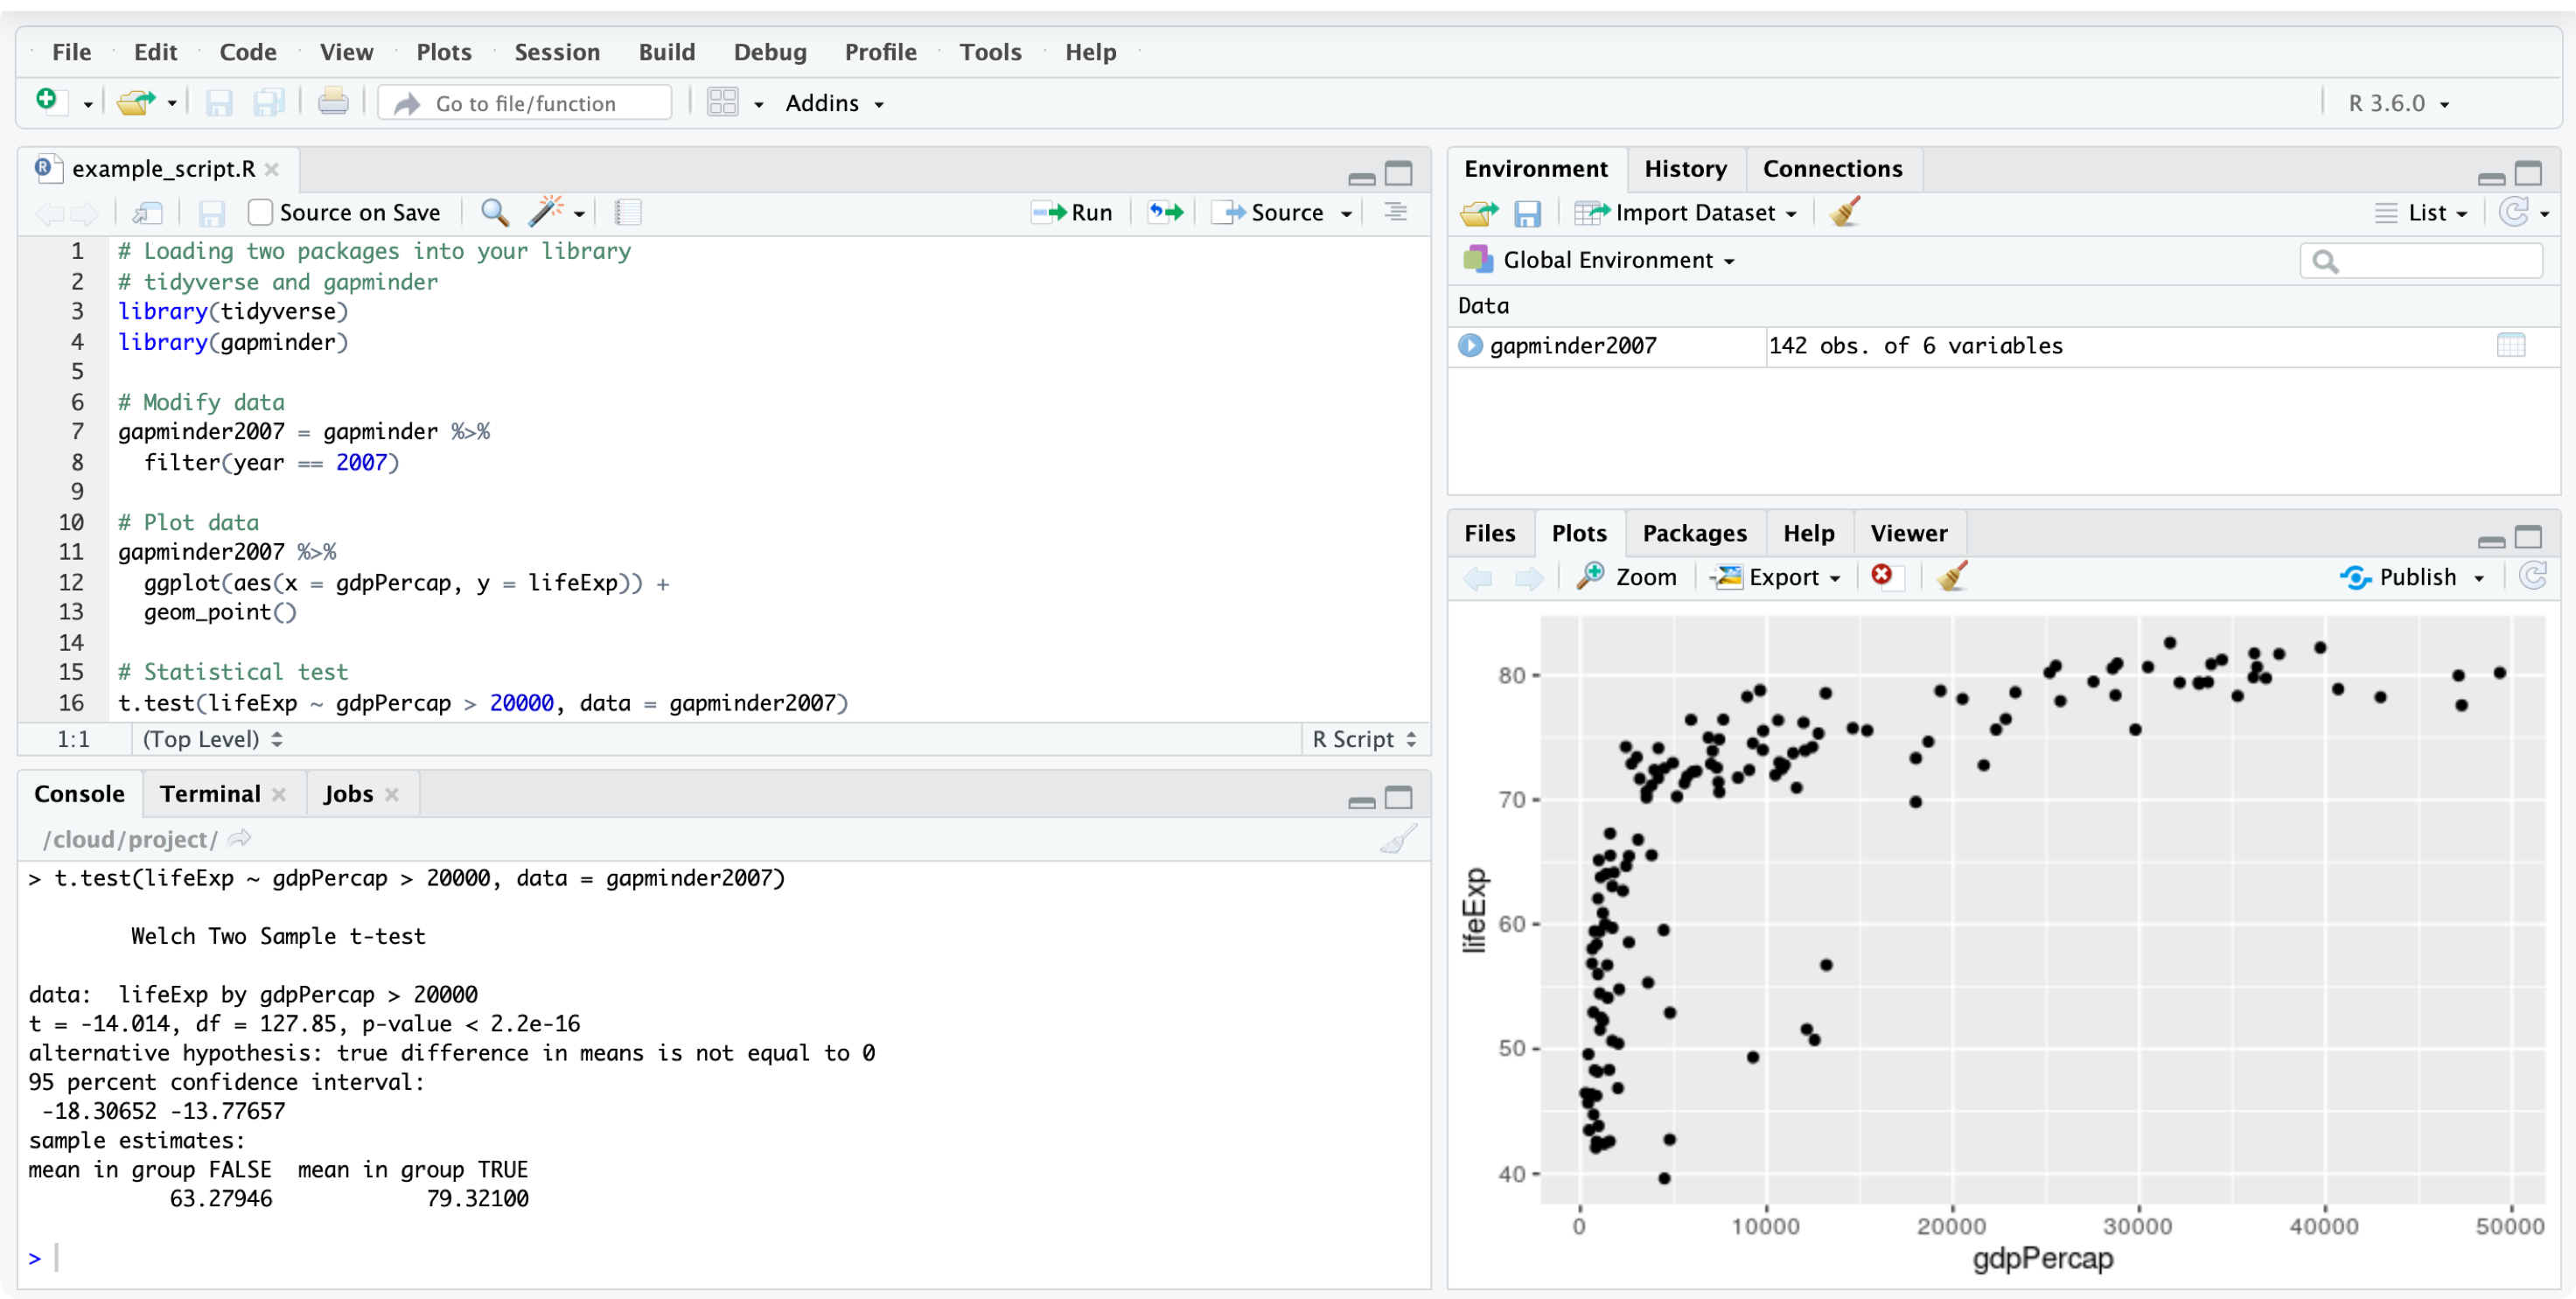
FIGURE 1.2: We use RStudio to work with R.
Now, look at the little Run and Source buttons at the top-right corner of the script pane. Clicking Run executes a line of R code. Clicking Source executes all lines of R code in the script (it is essentially ‘Run all lines’). When you run R code, it gets sent to the Console which is the bottom-left panel. This is where R really lives.
Keyboard Shortcuts!
Run line: Control+Enter
Run all lines (Source): Control+Shift+Enter
(On a Mac, both Control or Command work)
The Console is where R speaks to us. When we’re lucky, we get results in there - in this example the results of a t-test (last line of the script). When we’re less lucky, this is also where Errors or Warnings appear.
R Errors are a lot less scary than they seem! Yes, if you’re using a regular computer program where all you do is click on some buttons, then getting a proper red error that stops everything is quite unusual. But in programming, Errors are just a way for R to communicate with us.
We see Errors in our own work every single day, they are very normal and do not mean that everything is wrong or that you should give up.
Try to re-frame the word Error to mean “feedback”, as in “Hello, this is R. I can’t continue, this is the feedback I am giving you.”
The most common Errors you’ll see are along the lines of “Error: something not found”.
This almost always means there’s a typo or you’ve misspelled something.
Furthermore, R is case sensitive so capitalisation matters (variable name lifeExp is not the same as lifeexp).
The Console can only print text, so any plots you create in your script appear in the Plots pane (bottom-right).
Similarly, datasets that you’ve loaded or created appear in the Environment tab. When you click on a dataset, it pops up in a nice viewer that is fast even when there is a lot of data. This means you can have a look and scroll through your rows and columns, the same way you would with a spreadsheet.