12.1 What is a Notebook?
R is all-powerful for the manipulation, visualisation and analysis of data. What is often under-appreciated is the flexibility with which analyses can be exported or reported.
For instance, a full scientific paper, industry report, or monthly update can be easily written to accommodate a varying underlying dataset, and all tables and plots will be updated automatically.
This idea can be extended to a workflow in which all analyses are performed primarily within a document which doubles as the final report.
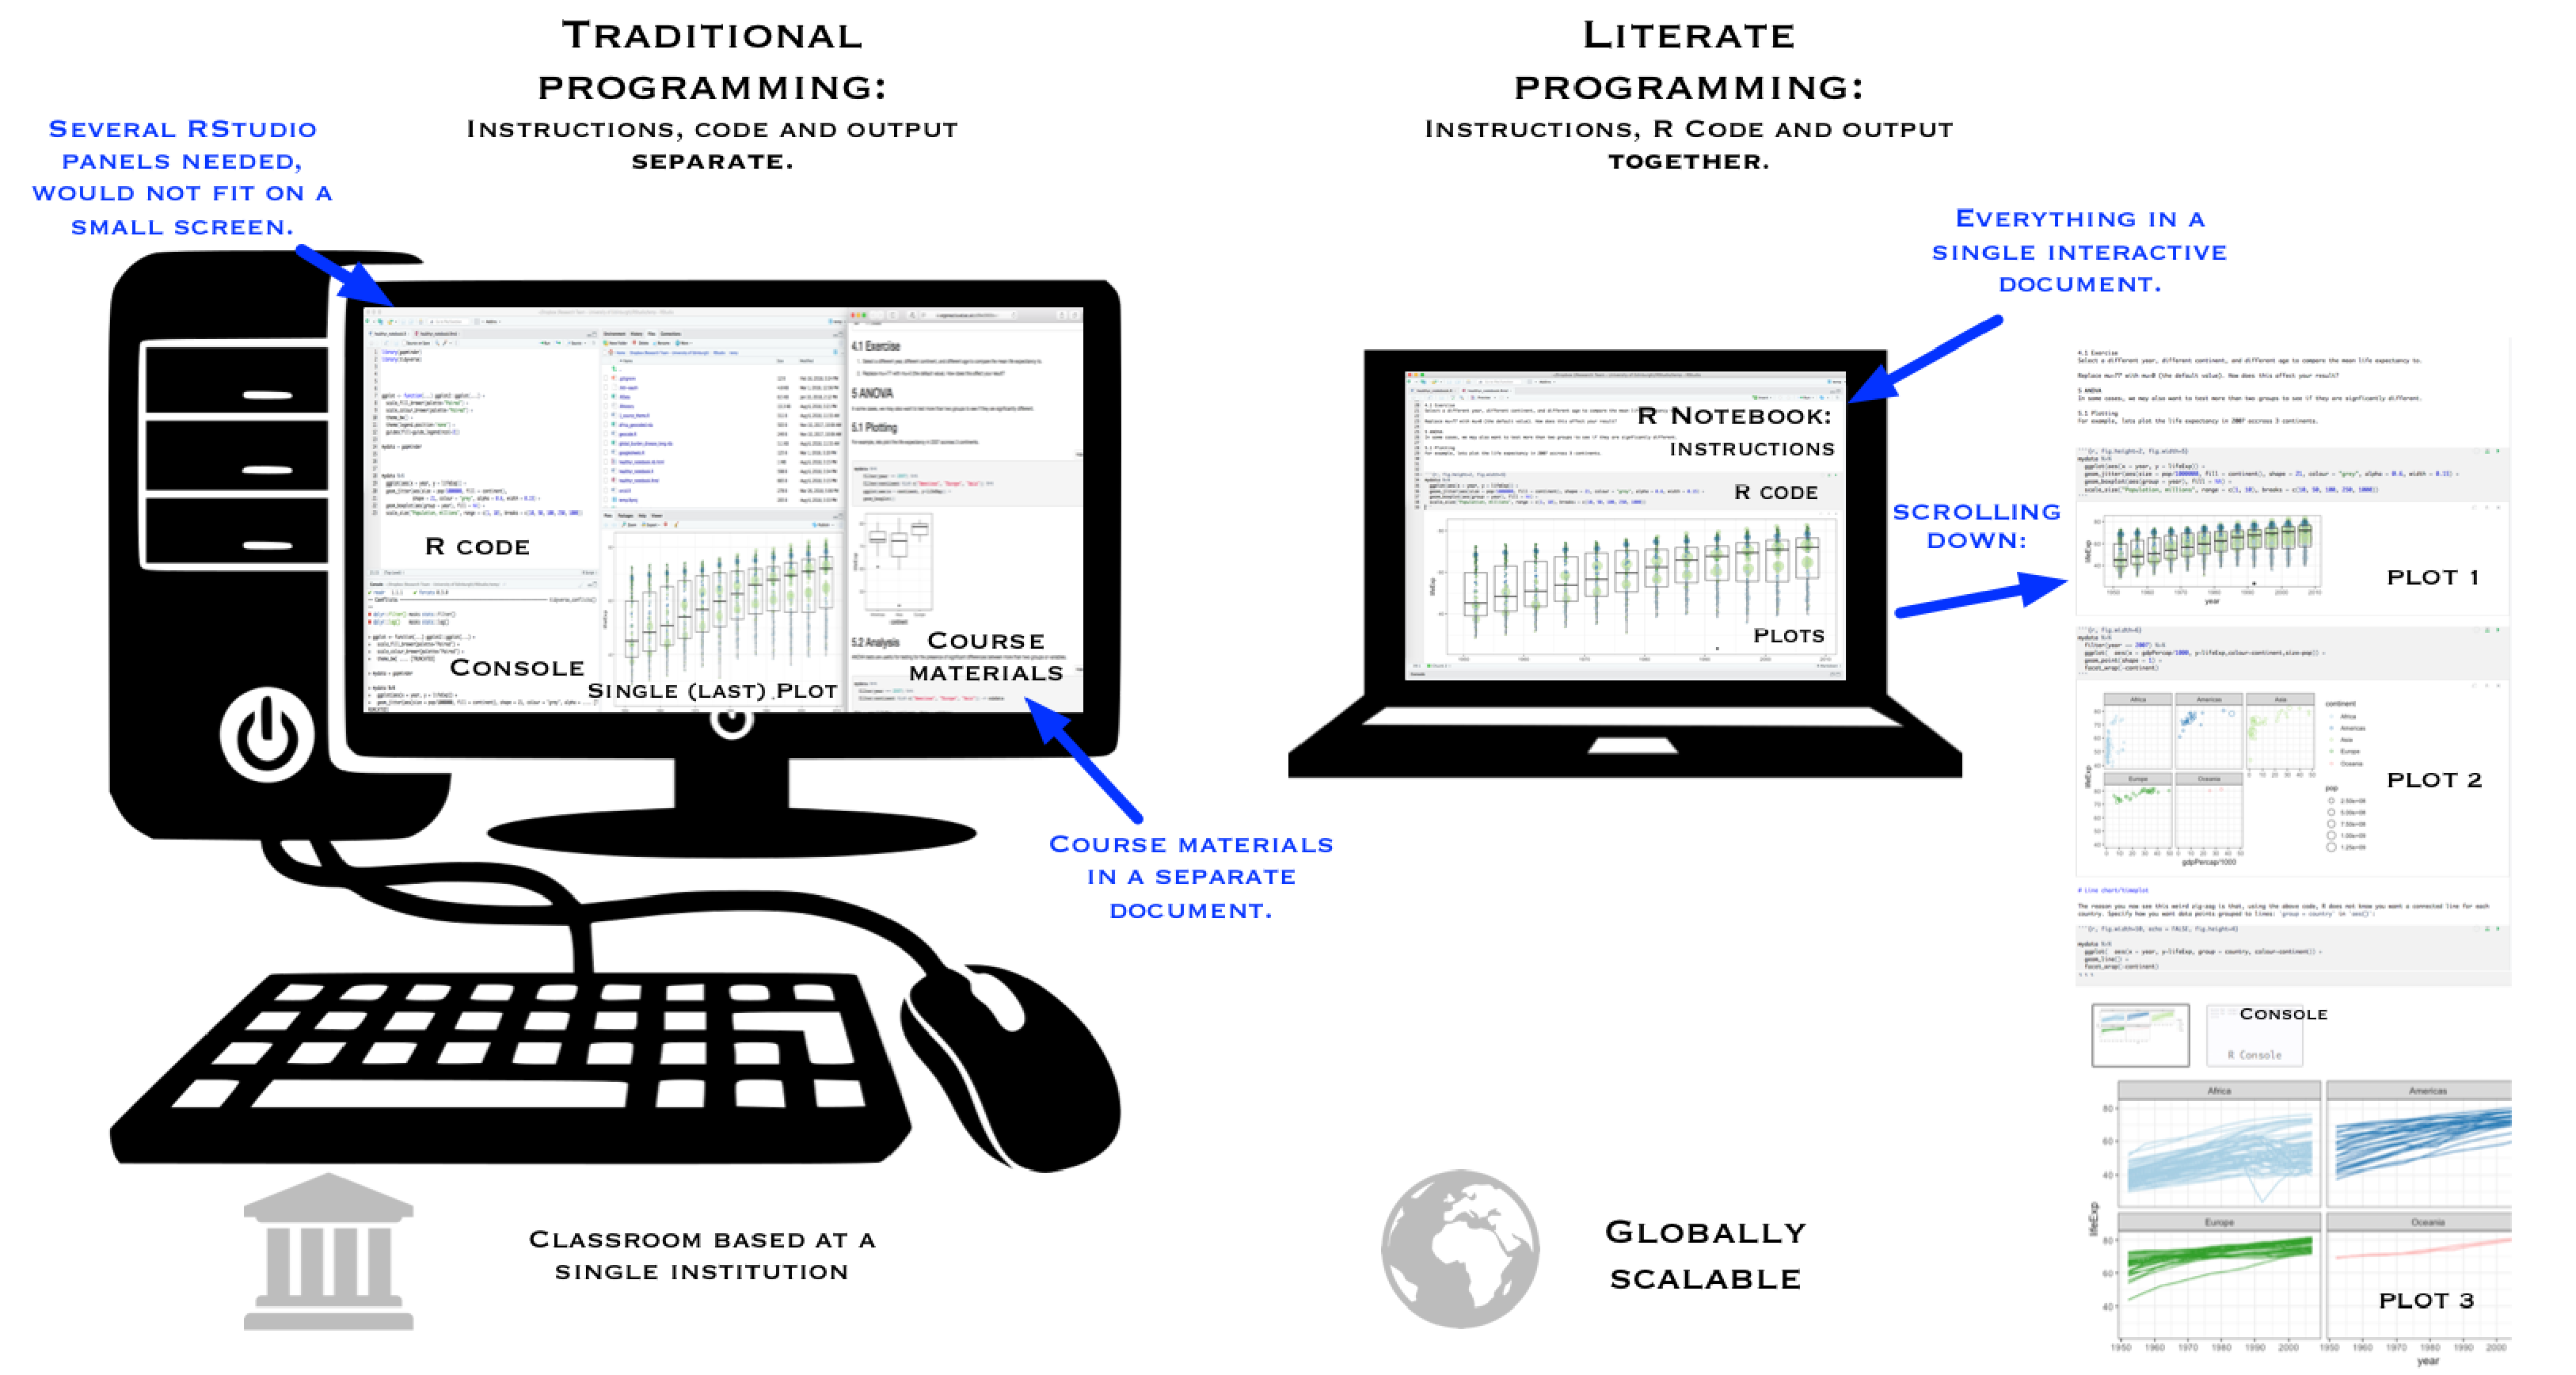
Enter “Data Notebooks”! Notebooks are documents which combine code and rich text elements, such as headings, paragraphs and links, in one document. They combine analysis and reporting in one human-readable document to provide an intuitive interface between the researcher and their analysis (Figure 12.1). This is sometimes called “literate programming”, given the resulting logical structure of information can be easily read in the manner a human would read a book.

FIGURE 12.1: Traditional versus literate programming using Notebooks.
In our own work, we have now moved to doing most of our analyses in a Notebook file, rather than using a “script” file. You may not have guessed, but this whole book is written in this way.
Some of the advantages of the Notebook interface are:
- code and output are adjacent to each other, so you are not constantly switching between “panes”;
- easier to work on smaller screen, e.g., laptop;
- documentation and reporting can be done beside the code, text elements can be fully formatted;
- the code itself can be outputted or hidden;
- the code is not limited to R - you can use Python, SQL etc.;
- facilitate collaboration by easily sharing human-readable analysis documents;
- can be outputted in a number of formats including HTML (web page), PDF, and Microsoft Word;
- output can be extended to other formats such as presentations;
- training/learning may be easier as course materials, examples, and student notes are all in the same document.