11.3 Identify missing values in each variable: missing_plot()
Visualising data is essential to help understand it, and missing data is no exception.
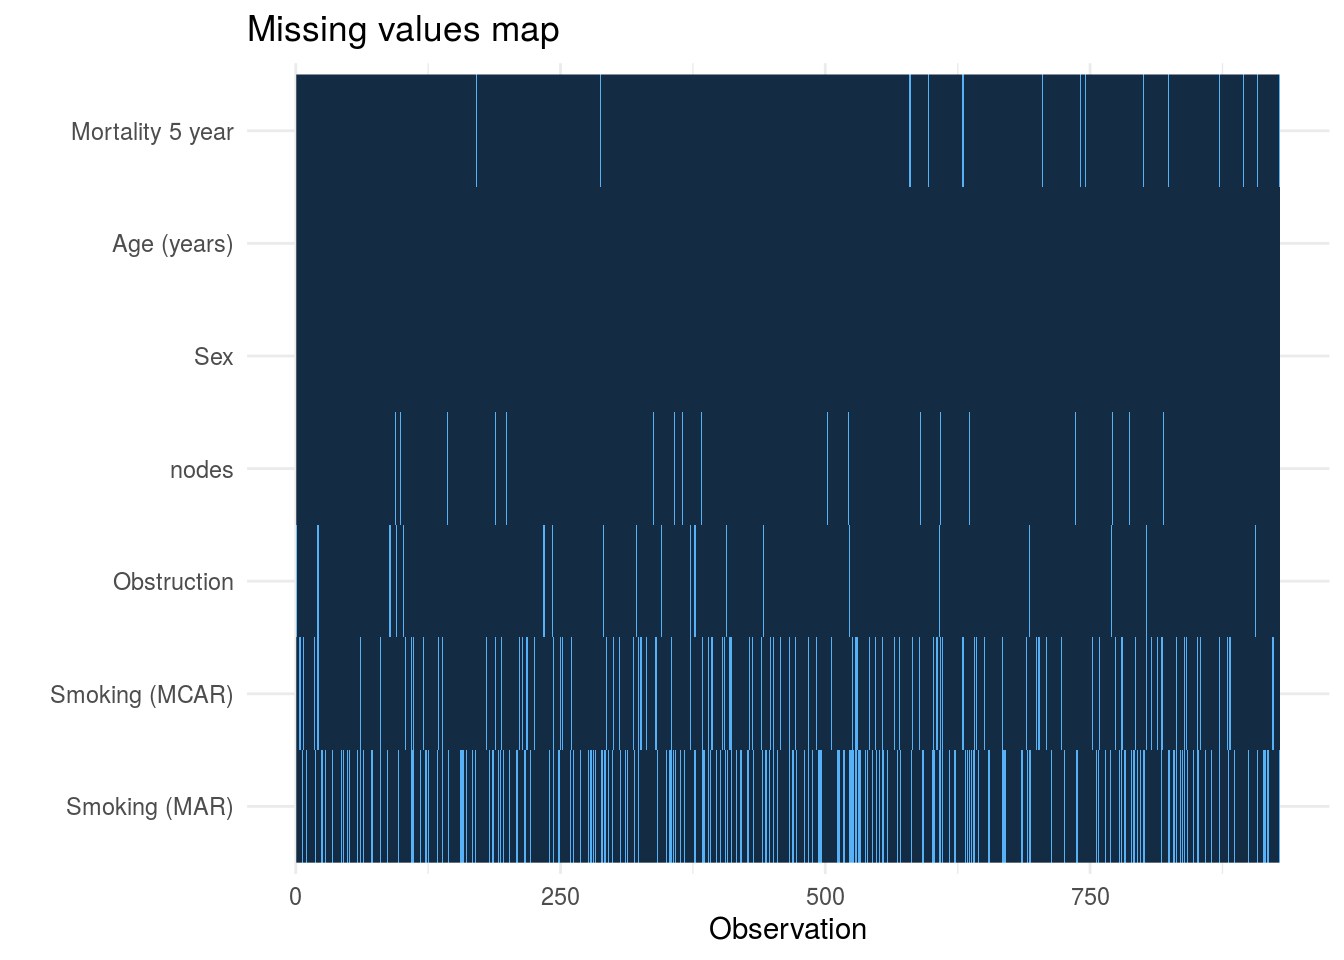
missing_plot() function also from finalfit is useful for grasping the amount of missing data in each variable.
Row number is on the x-axis and all included variables are on the y-axis.
Further visualisations of missingness can be done using the naniar package.