13.5 Odds ratio plot
It is often preferable to express the coefficients from a regression model as a forest plot.
For instance, a plot of odds ratios can be produced using the or_plot() function also from the finalfit package:
colon_s %>%
  or_plot(dependent, explanatory,
          breaks = c(0.5, 1, 5, 10, 20, 30),
          table_text_size = 3.5)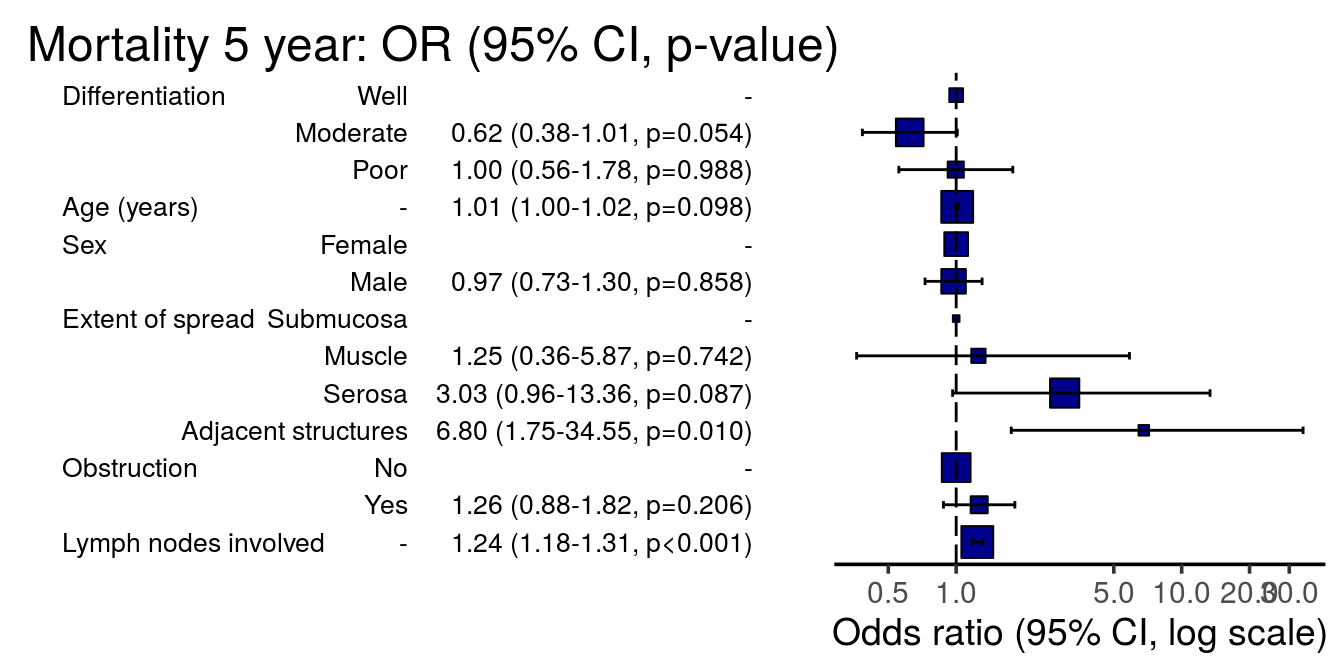
FIGURE 13.1: Odds ratio plot.