5.1 Get the data
We can save a ggplot() object into a variable (we usually call it p but it can be any name).
This then appears in the Environment tab.
To plot it it needs to be recalled on a separate line to get drawn (Figure 5.1).
Saving a plot into a variable allows us to modify it later (e.g., p + theme_bw()).
library(gapminder)
library(tidyverse)

p0 <- gapminder %>%
  filter(year == 2007) %>%
  ggplot(aes(y = lifeExp, x = gdpPercap, colour = continent)) +
  geom_point(alpha = 0.3) +
  theme_bw() +
  geom_smooth(method = "lm", se = FALSE) +
  scale_colour_brewer(palette = "Set1")

p0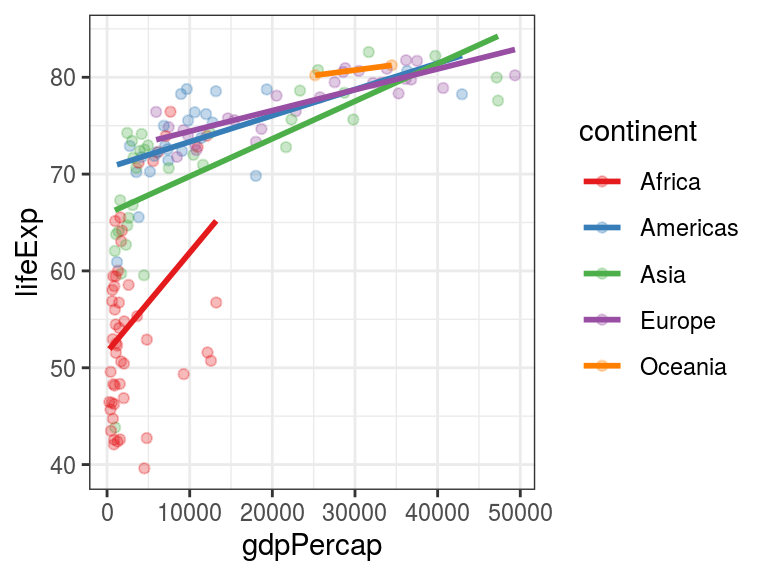
FIGURE 5.1: p0: Starting plot for the examples in this chapter.