13.6 MS Word via knitr/R Markdown
When moving from a .R file to a Markdown (.Rmd) file, environment objects such as tables or data frames / tibbles usually require to be saved and loaded to R Markdown document.
# Save objects for knitr/markdown
save(table1, table2, dependent, explanatory,
     file = here::here("data", "out.rda"))
In RStudio, select:
File > New File > R Markdown
A useful template file is produced by default. Try hitting knit to Word on the Knit button at the top of the .Rmd script window.
If you have difficulties at this stage, refer to Chapter 12.
Now paste this into the file (we’ll call it Example 1):
---
title: "Example knitr/R Markdown document"
author: "Your name"
date: "22/5/2020"
output:
  word_document: default
---

```{r setup, include=FALSE}
# Load data into global environment.
library(finalfit)
library(dplyr)
library(knitr)
load(here::here("data", "out.rda"))
```

## Table 1 - Demographics
```{r table1, echo = FALSE}
kable(table1, row.names=FALSE, align=c("l", "l", "r", "r", "r", "r"))
```

## Table 2 - Association between tumour factors and 5 year mortality
```{r table2, echo = FALSE}
kable(table2, row.names=FALSE, align=c("l", "l", "r", "r", "r", "r"))
```

## Figure 1 - Association between tumour factors and 5 year mortality
```{r figure1, echo = FALSE}
explanatory = c( "differ.factor", "age", "sex.factor",
                "extent.factor", "obstruct.factor",
                "nodes")
dependent = "mort_5yr"
colon_s %>%
  or_plot(dependent, explanatory)
```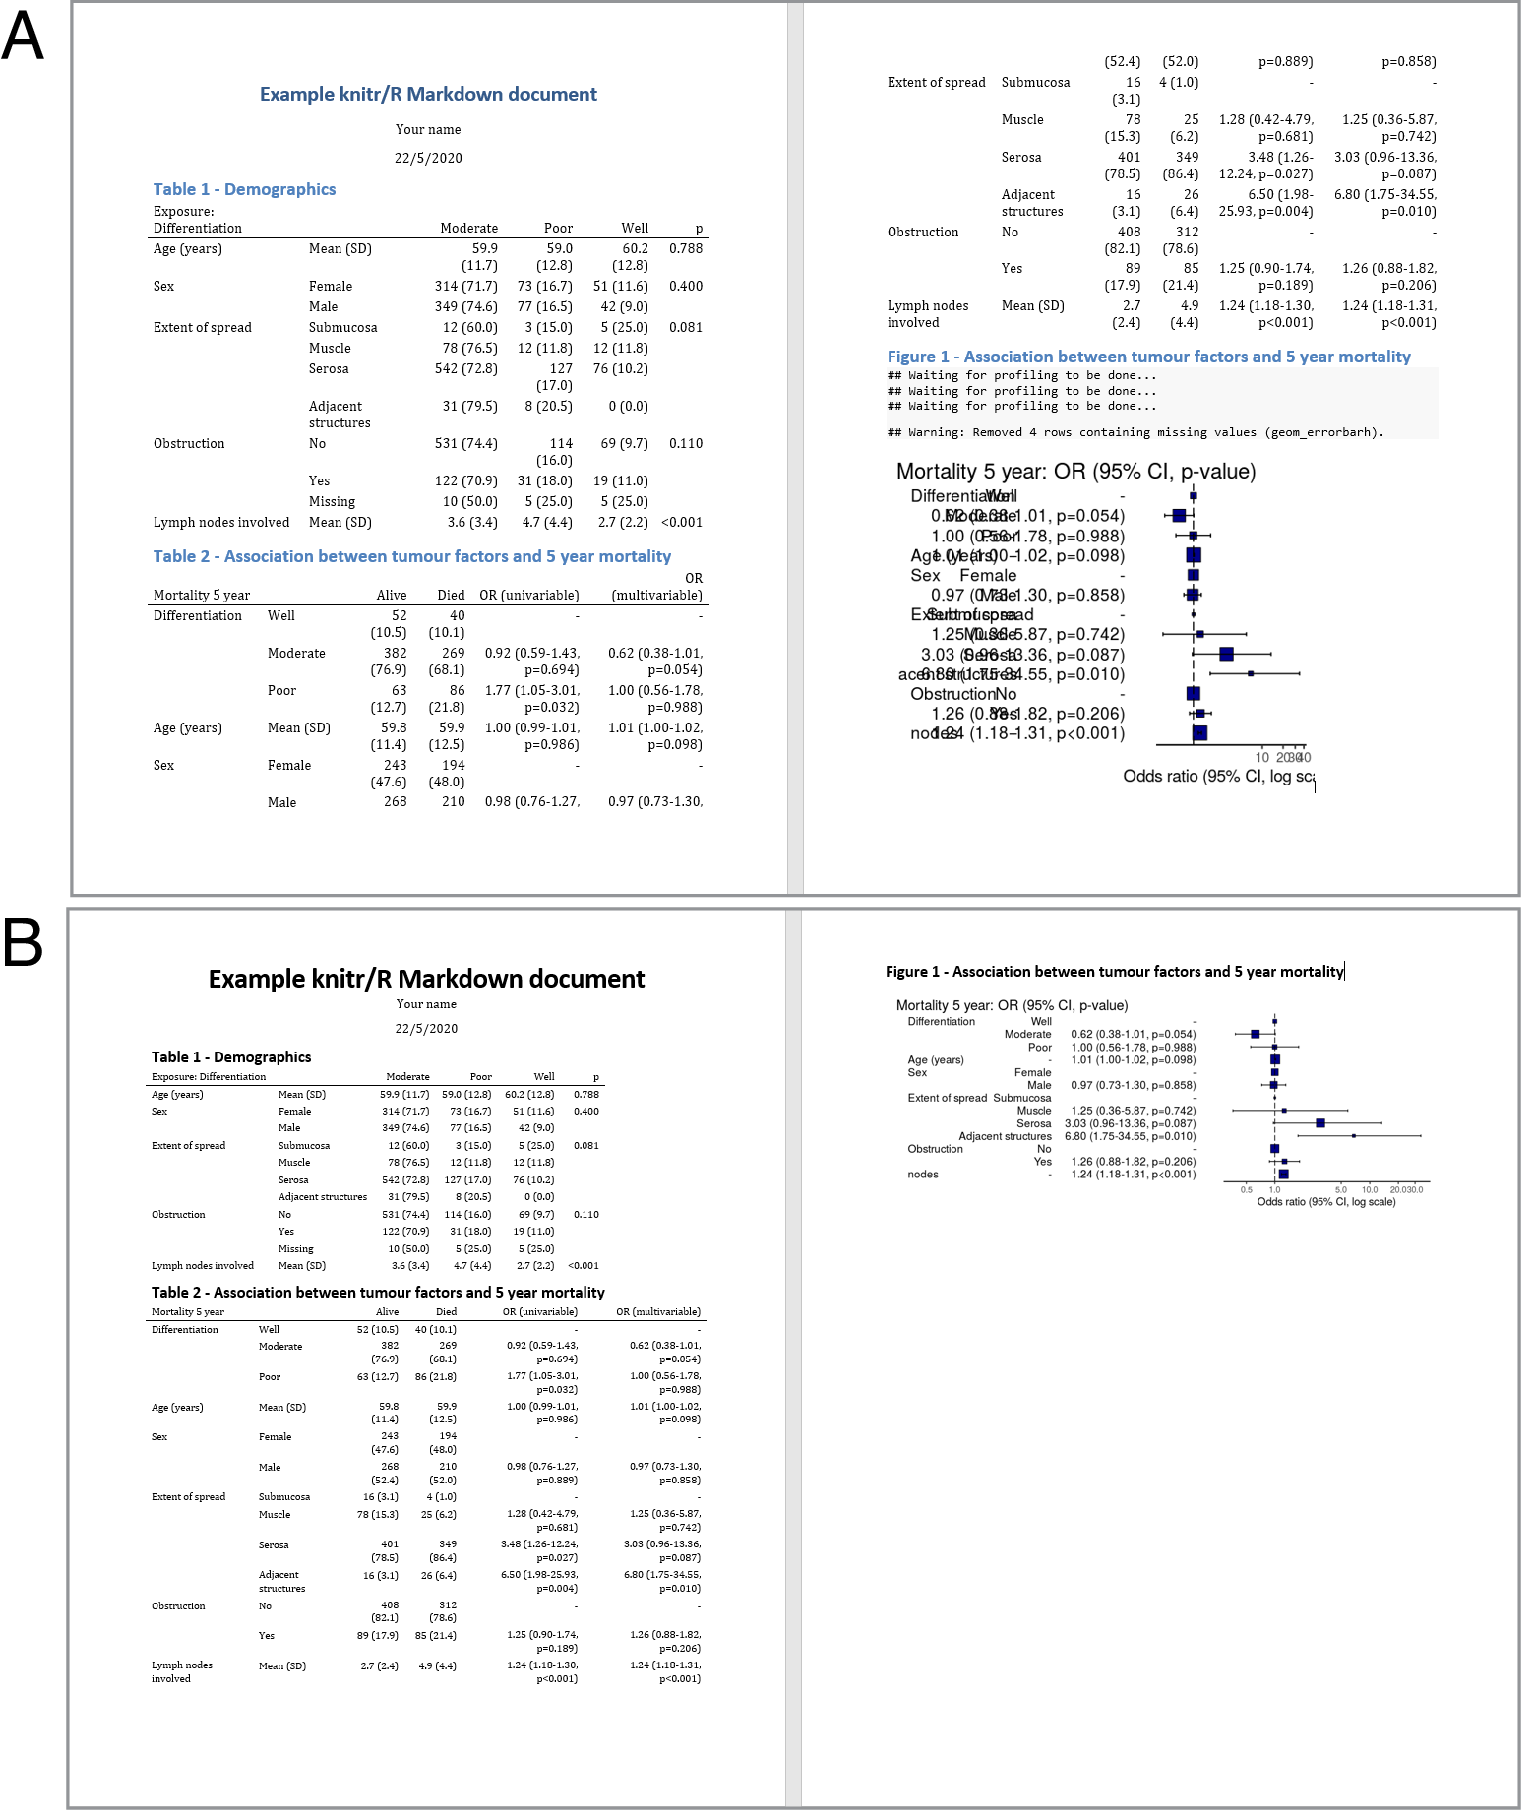
FIGURE 13.2: Knitting to Microsoft Word from R Markdown. Before (A) and after (B) adjustment.
Knitting this into a Word document results in Figure 13.2A), which looks pretty decent but some of the columns need some formatting and the plot needs resized. Do not be tempted to do this by hand directly in the Word document.
Yes, before Markdown, we would have to move and format each table and figure directly in Word, and we would repeat this every time something changed. Turns out some patient records were duplicated and you have to remove them before repeating the analysis over again. Or your colleague forgot to attach an extra file with 10 more patients.
No problem, you update the dataset, re-run the script that created the tables and hit Knit in the R Markdown document. No more mindless re-doing for you. We think this is pretty amazing.
13.6.1 Figure quality in Word output
If your plots are looking a bit grainy in Word, include this in your setup chunk for high quality:
The setup chunk is the one that starts with ```{r setup, include = FALSE} and is generated automatically when you create a new R Markdown document in RStudio.