10.7 Kaplan Meier plot
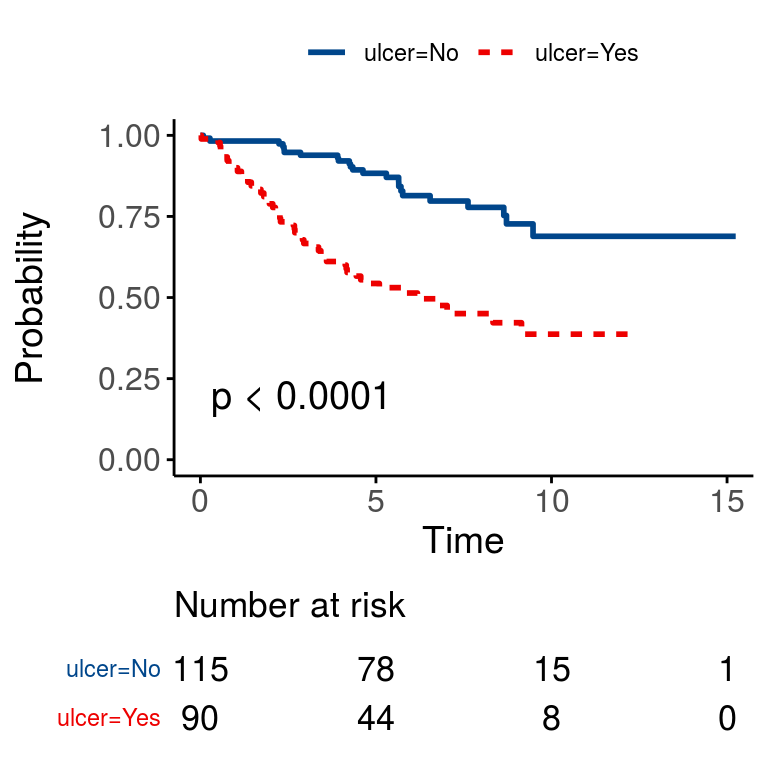
We can plot survival curves using the finalfit wrapper for the package survminer. There are numerous options available on the help page. You should always include a number-at-risk table under these plots as it is essential for interpretation.
As can be seen, the probability of dying is much greater if the tumour was ulcerated, compared to those that were not ulcerated.
dependent_os <- "Surv(time/365, status_os)"
explanatory  <- c("ulcer")

melanoma %>%
    surv_plot(dependent_os, explanatory, pval = TRUE)
## Warning: Vectorized input to `element_text()` is not officially supported.
## Results may be unexpected or may change in future versions of ggplot2.