1.3 Getting started
To start using R, you should do these two things:
- Install R (from https://www.r-project.org/)
- Install RStudio Desktop (from https://www.rstudio.com/)
When you first open up RStudio, you’ll also want to install some extra packages to extend the base R functionality. You can do this in the Packages tab (next to the Plots tab in the bottom-right in Figure 1.2).
A Package is just a collection of functions (commands) that are not included in the standard R installation, called base-R.
A lot of the functionality introduced in this book comes from the tidyverse family of R packages (http://tidyverse.org Wickham et al. (2019)). So when you go to Packages, click Install, type in tidyverse, and a whole collection of useful and modern packages will be installed.
Even though you’ve installed the tidyverse packages, you’ll still need to tell R when you’re about to use them.
We include library(tidyverse) at the top of every script we write:
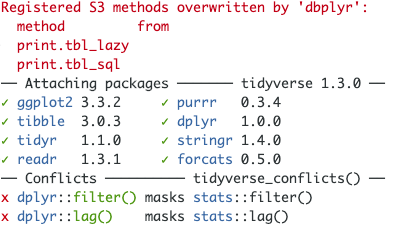
We can see that it has loaded 8 packages (ggplot2, tibble, tidyr, readr, purrr, dplyr, stringr, forcats), the number behind a package name is its version.
The “Conflicts” message is expected and can safely be ignored.1
There are a few other R packages that we use and are not part of the tidyverse, but we will introduce them as we go along. If you’re incredibly curious, head to the Resources section of the HealthyR website which is the best place to find up-to-date links and installation instructions. Our R and package versions are also listed in the Appendix.
References
Wickham, Hadley, Mara Averick, Jennifer Bryan, Winston Chang, Lucy McGowan, Romain François, Garrett Grolemund, et al. 2019. “Welcome to the Tidyverse.” Journal of Open Source Software 4 (43): 1686. https://doi.org/10.21105/joss.01686.
It just means that when we use
filterorlag, they will come from the dplyr package, rather than the stats package. We’ve never needed to usefilterandlagfrom stats, but if you do, then use the double colon, i.e.,stats::filter()orstats::lag(), as justfilter()will use the dplyr one.↩︎