1.1 Help, what’s a script?
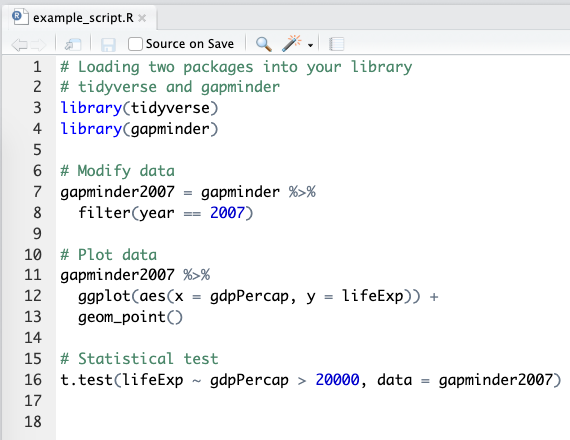
A script is a list of instructions. It is just a text file and no special software is required to view one. An example R script is shown in Figure 1.1.
Don’t panic! The only thing you need to understand at this point is that what you’re looking at is a list of instructions written in the R language.
You should also notice that some parts of the script look like normal English. These are the lines that start with a # and they are called “comments”. We can (and should) include these comments in everything we do. These are notes of what we were doing, both for colleagues as well as our future selves.

FIGURE 1.1: An example R script from RStudio.
Lines that do not start with # are R code. This is where the number crunching really happens. We will cover the details of this R code in the next few chapters. The purpose of this chapter is to describe some of the terminology as well as the interface and tools we use.
For the impatient:
- We interface R using RStudio
- We use the tidyverse packages that are a substantial extension to base R functionality (we repeat: extension, not replacement)
Even though R is a language, don’t think that after reading this book you should be able to open a blank file and just start typing in R code like an evil computer genius from a movie. This is not what real-world programming looks like.
Firstly, you should be copy-pasting and adapting existing R code examples - whether from this book, the internet, or later from your existing work. Re-writing everything from scratch is not efficient. Yes, you will understand and eventually remember a lot of it, but to spend time memorising specific functions that can easily be looked up and copied is simply not necessary.
Secondly, R is an interactive language. Meaning that we “run” R code line by line and get immediate feedback. We do not write a whole script without trying each part out as we go along.
Thirdly, do not worry about making mistakes. Celebrate them! The whole point of R and reproducibility is that manipulations are not applied directly on a dataset, but a copy of it. Everything is in a script, so you can’t do anything wrong. If you make a mistake like accidentally overwriting your data, we can just reload it, rerun the steps that worked well and continue figuring out what went wrong at the end. And since all of these steps are written down in a script, R will redo everything with a single push of a button. You do not have to repeat a set of mouse clicks from dropdown menus as in other statistical packages, which quickly becomes a blessing.