Chapter 4 Different types of plots
What I cannot create, I do not understand.
Richard Feynman
There are a few different plotting packages in R, but the most elegant and versatile one is ggplot211. gg stands for grammar of graphics which means that we can make a plot by describing it one component at a time. In other words, we build a plot by adding layers to it.
This does not have to be many layers, the simplest ggplot() consists of just two components:
- the variables to be plotted;
- a geometrical object (e.g., point, line, bar, box, etc.).
ggplot() calls geometrical objects geoms.
Figure 4.1 shows some example steps for building a scatter plot, including changing its appearance (‘theme’) and faceting - an efficient way of creating separate plots for subgroups.
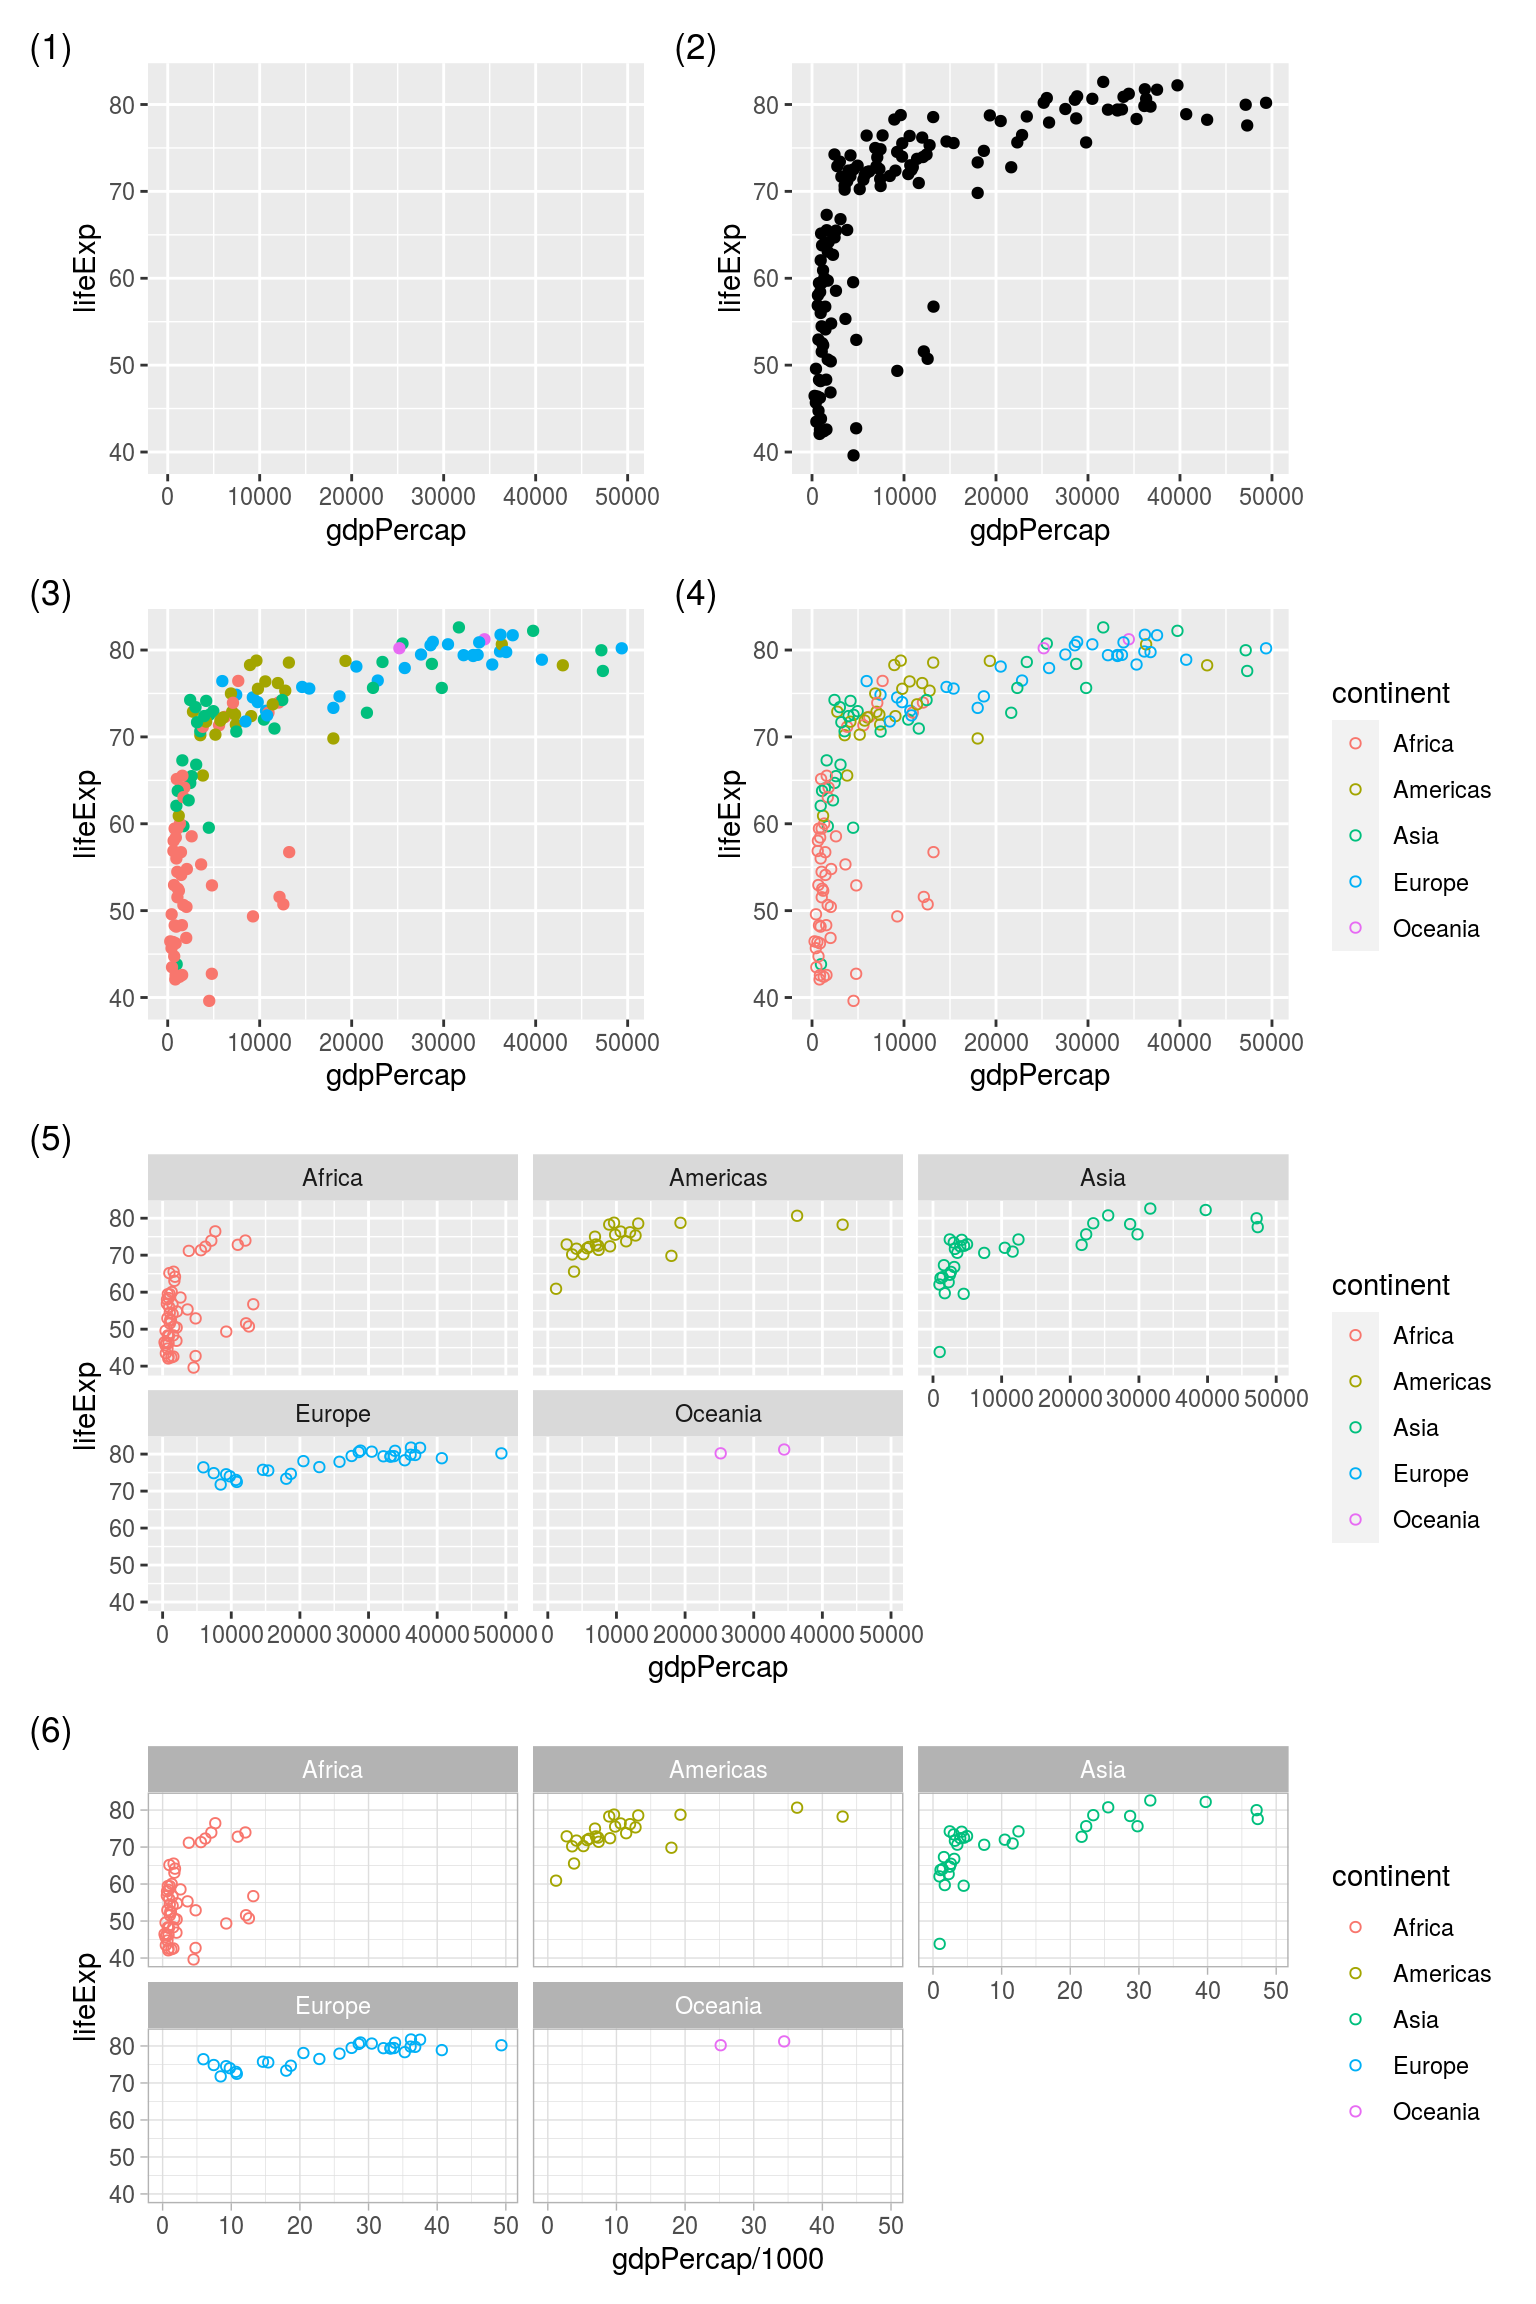
FIGURE 4.1: Example steps for building and modifying a ggplot. (1) Initialising the canvas and defining variables, (2) adding points, (3) colouring points by continent, (4) changing point type, (5) faceting, (6) changing the plot theme and the scale of the x variable.